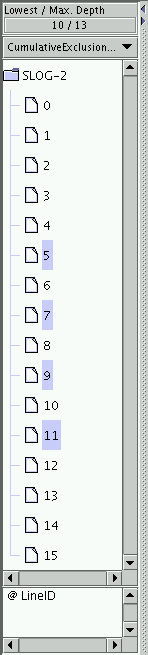
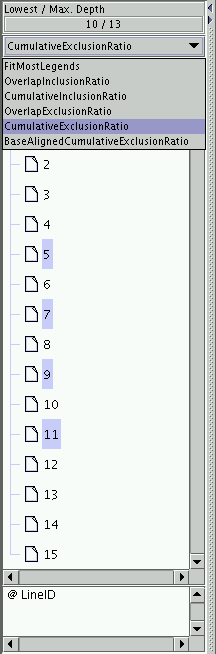
The concealable left panel in Timeline window is called the y-axis label panel. It contains a tree-like representation for the y-axis label for the timelines. For a SLOG-2 file convertible from CLOG, CLOG-2 or RLOG with the default viewmap, the typical y-axis label panel looks like that shown in Figure 3.21. Together with the toolbar's label buttons (e.g., LabelMark and LabelMove) and standard mouse selection methods listed in Table 3.12, labels can be rearranged easily to create a more easily understood timeline canvas. For the multiple-viewmaps SLOG-2 file from IBM's UTE trace environment, the LabelExpand and LabelCollapse buttons will come in handy to expand and collapse the label tree by one whole level. In order to minimize unnecessary redraw of the timeline canvas, the synchronization between the label panel and the timeline canvas is carried out passively; that is, the user needs to press the CanvasReDraw button in the toolbar to update the Timeline window with the changes from the label panel.
|