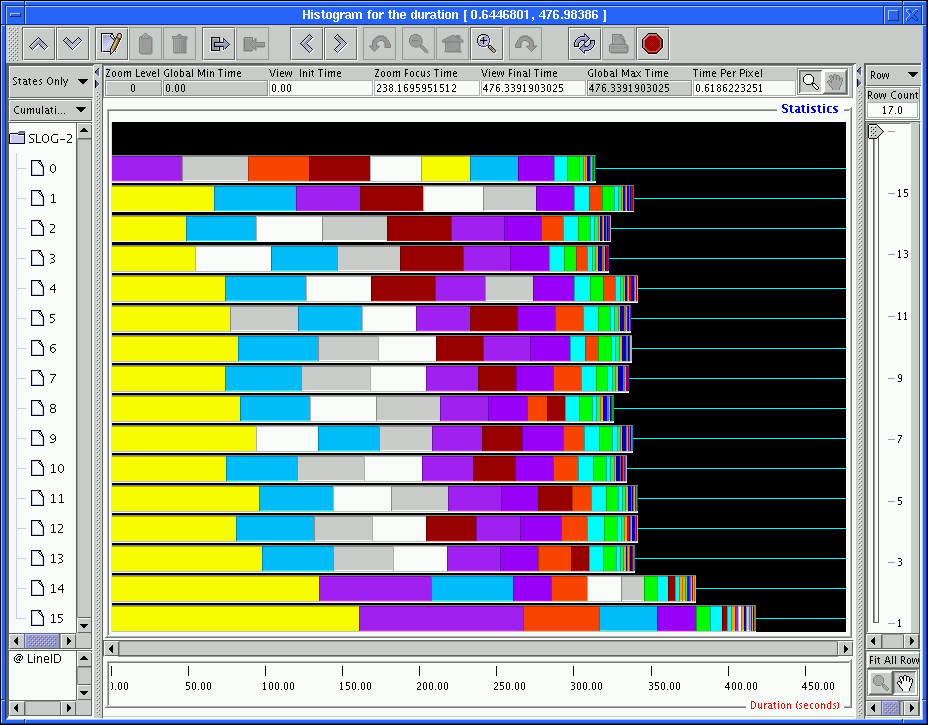
The Histogram window is created by clicking the statistics button located in the middle of Duration Info Box, shown in Figure 3.19. In Figure 3.23, the Histogram window is created for the whole duration of the timeline canvas in Figure 3.10, that is, the same duration as the complete slog2 file. In general, the total duration of the histogram canvas is the same as the duration marked by the Duration Info Box, so that the Histogram window functions like a graphical display of statistical summary of the duration of interest. For instance, it is obvious from Figure 3.23 that the yellow state (MPI_Barrier in this case) cumulatively takes up the most time. This is especially true in the last timeline.
Since the Histogram window is also a zoomable window like the Timeline window, a lot of the features described in Section 3.4.1 for the Timeline window are available for the Histogram window as well, for example, dragged-zoom, grasp and scroll, instant zoom in/out, easy vertical expansion of timeline, and cut and paste of timelines. If some state categories or timelines need to be made invisible in the Histogram window, one can disable the corresponding categories in the Legend window's column V or S or selected corresponding timelines in the Histogram window. The process is just like that for the Timeline window.
Only summary objects can be displayed in the Histogram window. Summary objects are similar to preview objects discussed earlier. However, whereas Preview objects are created during the logfile creation stage and cannot be modified during visualization, Summary objects are created dynamically during visualization, that is, during creation of a Duration Info Box, so they can be modified easily by the user. There are two different kinds of summary objects: summary state and summary arrow. There is only one summary state per timeline and one summary arrow for each ordered pair of timelines.3.9 Currently three different views are available in the Histogram window: States Only, Arrows Only, and All. In the States Only view, only summary states are displayed. In the Arrows Only view, only summary arrows are displayed. In the All view, both summary states and arrows are displayed.