|
The goal of the Statistical Preview is to help users select a frame for viewing.
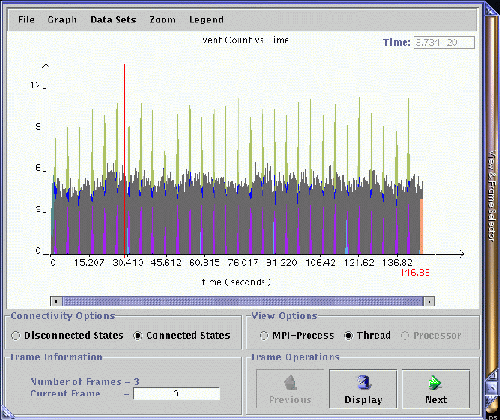
It consists of two windows. The major window shown in Figure ![[*]](crossref.gif) ,
is titled ``View & Frame Selector'', but is usually called ``Preview''.
It contains a graphical representation of all the activities going on during
the run of the program sppm. Activities in ``Preview'' are computed in
the following way. The whole duration of the job sppm is divided into 512 time
bins. For each time bin, there are counters for each state and arrow that occur
in the time bin. The counter of each state/arrow will be incremented by a statistical
weight that equals the ratio of the duration of state/arrow to the width of
time bin that the state/arrow is in. Because of this definition of the statistical
weight for each state/arrow, very short duration states or arrows become statistically
insignificant and will not contribute much to the accumulative activities of
all the states and arrows. The visual consequence is that states/arrows with
very short duration are not noticeable in ``Preview''. The graphical representation
of the activities of the logfiles is, by default, in accumulative histogram
mode, which can be turned on/off through the button selection sequence Graph->Type->Bar.
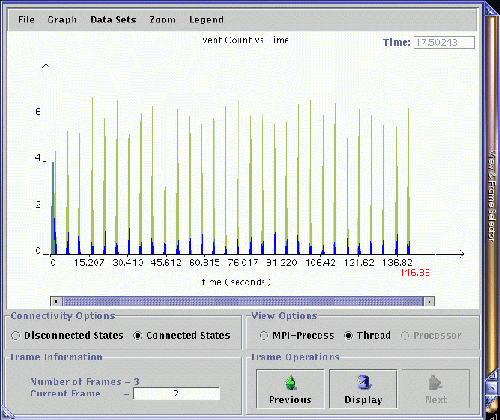
The other mode is the noncumulative curve mode which can be enabled by the button
selection sequence Graph->Type->Line. It is shown in Figure
,
is titled ``View & Frame Selector'', but is usually called ``Preview''.
It contains a graphical representation of all the activities going on during
the run of the program sppm. Activities in ``Preview'' are computed in
the following way. The whole duration of the job sppm is divided into 512 time
bins. For each time bin, there are counters for each state and arrow that occur
in the time bin. The counter of each state/arrow will be incremented by a statistical
weight that equals the ratio of the duration of state/arrow to the width of
time bin that the state/arrow is in. Because of this definition of the statistical
weight for each state/arrow, very short duration states or arrows become statistically
insignificant and will not contribute much to the accumulative activities of
all the states and arrows. The visual consequence is that states/arrows with
very short duration are not noticeable in ``Preview''. The graphical representation
of the activities of the logfiles is, by default, in accumulative histogram
mode, which can be turned on/off through the button selection sequence Graph->Type->Bar.
The other mode is the noncumulative curve mode which can be enabled by the button
selection sequence Graph->Type->Line. It is shown in Figure ![[*]](crossref.gif) .
Since it is noncumulative, as in histogram mode, it distinguishes the relative
importance of various states.
.
Since it is noncumulative, as in histogram mode, it distinguishes the relative
importance of various states.
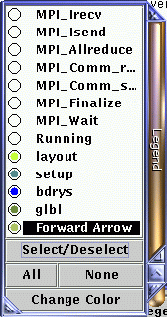
Next to the ``Preview'' there is a smaller window titled ``Legend'', which contains a set of radio buttons with different colors. They are tagged with the names of the MPI and user-defined calls made in the code sppm. An illustration of ``Legend'' is shown in Figure
![[*]](crossref.gif) . Below
the list of radio buttons there are Select/Deselect, All, None,
and Change Color buttons.
. Below
the list of radio buttons there are Select/Deselect, All, None,
and Change Color buttons.
``Preview'' and its corresponding ``Legend'' windows meant to be
used side by side to help you select frames that are of interest. If some of
the states displayed in the ``Preview'' seem useless or confusing, it
can be easily removed. First highlight the state through click on the name in
the ``Legend''; then click on Select/Deselect button to remove
them from ``Preview''. In Figure ![[*]](crossref.gif) ,
all MPI and system-related states are deselected in ``Preview'' to highlight
the user-defined states ``layout'', ``setup'', ``bdrys'' and
``glbl''. It becomes apparent that all the communications between the
user MPI processes are done in regular interval. Also, all communications(i.e.
arrows) are within the user-defined state ``bdrys''. Assume you are interested
in the behavior of the program between the last two instances of MPI_Allreduce.
Then you can simply click on None to deselect all the states and arrows,
highlight MPI_Allreduce, then click Select/Deselect to display only
MPI_Allreduce in the ``Preview''. Now click on any region between the
last two MPI_Allreduce's in the ``Preview''. Then the frame index is
changed from 0 to 2, and a red line is positioned in the middle of the frame
2 and is also between the last two instances of MPI_Allreduce. Now select the
properties of the frame to be viewed. Most end users who are interested in the
performance of the code sppm should select the Connected States option
with either MPI-Process or Thread view. If you are interested
in how the operating system dispatches threads among CPUs allocated for the
job, you may want to select the Disconnected States option in the Processor
view.
,
all MPI and system-related states are deselected in ``Preview'' to highlight
the user-defined states ``layout'', ``setup'', ``bdrys'' and
``glbl''. It becomes apparent that all the communications between the
user MPI processes are done in regular interval. Also, all communications(i.e.
arrows) are within the user-defined state ``bdrys''. Assume you are interested
in the behavior of the program between the last two instances of MPI_Allreduce.
Then you can simply click on None to deselect all the states and arrows,
highlight MPI_Allreduce, then click Select/Deselect to display only
MPI_Allreduce in the ``Preview''. Now click on any region between the
last two MPI_Allreduce's in the ``Preview''. Then the frame index is
changed from 0 to 2, and a red line is positioned in the middle of the frame
2 and is also between the last two instances of MPI_Allreduce. Now select the
properties of the frame to be viewed. Most end users who are interested in the
performance of the code sppm should select the Connected States option
with either MPI-Process or Thread view. If you are interested
in how the operating system dispatches threads among CPUs allocated for the
job, you may want to select the Disconnected States option in the Processor
view.


|