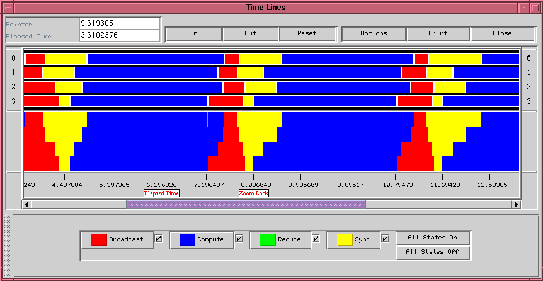
The primary view of logfile data is the ``timeline window'' in which time (in seconds) is indicated from left to right and MPI process ranks are shown from top to bottom. Colored rectangles spanning sections of the timelines indicate that a particular process was in a particular state during the indicated time interval. These states are defined by the logging library and typically consist of MPI function call durations and the durations of user-defined states. Clicking with the mouse on such a rectangle pops up a small window containing detailed information (state name, precise duration, etc.) Arrows show messages, and details about a particular message (length, tag, etc.) appear when one clicks on the small circle appearing near the origin of an arrow.
As the user moves the mouse in this window, its position along the time axis is dynamically tracked in the box labeled ``Pointer'' at the upper left of the frame. If the user presses the ``t'' key, the origin of the ``Elapsed Time'' field is set wherever the cursor is, and elapsed time is set to 0, enabling very precise measurements of time intervals with the mouse.
If the ``z'' key is pressed with the mouse cursor in the window, the zooming
origin is set, and the ``In'' and ``Out'' buttons cause the display to expand
and contract horizontally. When the display is zoomed in, the scrollbar along
the bottom allows the user to scroll the view back and forth. A number of
techniques, such as drawing portions of the display into memory even when they
are not visible, smooth the action of the scrolling, even at high zoom
factors. ``Reset'' returns the display to its original configuration.
``Options'' presents a menu of system configuration options, such as the
default zoom factor, ``Print'' allows for printing a Postscript version of the
display, and ``Close'' exits. One of the options is to show a ``mountain
range'' view of the data, which agglomerates states to show the number of
processes in each state at each time. Figure 4
shows a trace from
the cpilog program distributed with MPICH, with both timeline and
mountain range data shown in coupled scrollable windows. This program
computes the value of
by numerical integration and consists of compute
stages intermixed with global operations. It illustrates the use of
user-defined states. Currently the mountain range view is not valid for
nested states.
