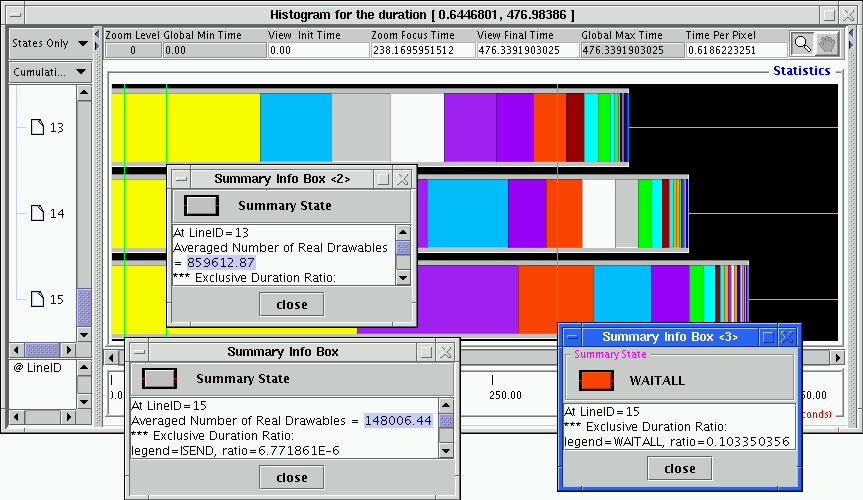
Since summary states are created through the statistics of real and preview states, summary states the inherit properties of preview states, that is, inclusion and exclusion ratios. Hence, different representations of summary state are formed based on the PREVIEW_STATE_DISPLAY discussed in Section 2.2.1. Different representations of summary states can be selected through the SUMMARY_STATE_DISPLAY pulldown menu located at the top of the left panel in the histogram window or through a similar variable defined in the Preference window and in Table 3.22. Figure 3.23 is actually a CumulativeExclusionRatio view. Since the most time-consuming timeline is the last one, we will zoom in on the last three timelines and use them to discuss the visual representation of summary state. Figure 3.24 shows the last three timelines of Figure 3.23. Each summary state has a gray bordered box. Right mouse clicking at the bordered box pops up the Summary Info Box for the whole summary state. The info box lists the total number of real states it contains and detailed information of what state categories it contains. In the figure, the summary info boxes at timeline 15 and 13 show that the timeline 15 summary state contains about 148,006 real states and the timeline 13 summary state has about 859,613 real states; that is, timeline 13 has 5.8 times the number of real states than that of timeline 15 within the same duration. Each summary state also displays the ratios of the total duration of each member state category to the duration of the canvas as colored boxes inside the gray bordered box. Right clicking on any of the colored boxes will display a summary info box that indicates the color and name of category and the corresponding ratio for the duration; see, for example, the highlighted summary info box in the Figure 3.24. The remaining duration at the end of each timeline is unaccounted for. In this particular logfile, the remaining time could be thought of as being used for computation.
Switching the SUMMARY_STATE_DISPLAY pulldown menu in the Histogram window in the figure to OverlapInclusionRatio redraws the histogram canvas. The histogram canvas now looks like the one shown in Figure 3.25. Since the sum of all inclusion ratios is greater than 1.0, theCumulativeInclusionRatio view is not provided in the Histogram window.3.10 All the member categories of the summary states in theOverlapInclusionRatio view are drawn from the beginning of the histogram canvas and are nested one inside the others in decreasing inclusion ratio order, so the largest inclusion ratios are easily noticeable. To see the smallest ratios, one needs to zoom in around the beginning of the canvas. In Figure 3.25, the largest inclusion ratios in the three visible timelines are all royal blue and take up about the same amount of time. The second largest ratios are all orange colored and smallest in the timeline 15. Therefore, the OverlapInclusionRatio is good for comparing member category contribution among different timelines.